Flip through
the panels in a
panel stack.
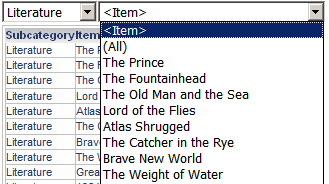
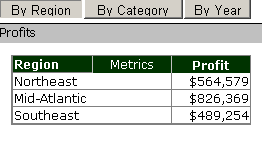
A panel stack is a collection of panels, which allow the user to see different
predefined views of data in the same document, as shown in the image below.
For steps to create a selector to flip through the panels in a panel stack,
see
Creating a selector
for a panel stack.
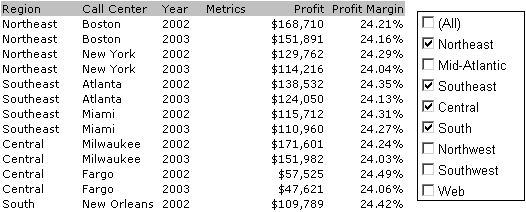
Display different metrics or different elements of attributes, custom groups, or consolidations in a Grid/Graph, as shown in the image below. For steps to create a selector to:
Choose the elements to display on a Grid/Graph, see Creating a selector for elements on a Grid/Graph.
Choose the metrics to display on a Grid/Graph, see Creating a selector for a metric on a Grid/Graph.
