You can create a selector that allows a user to filter data based on the value of a metric. The selector can be either of the following:
A slider,
which the user moves to select the minimum and maximum values to display.
For example, a document contains a Grid/Graph with Region and the Revenue
metric. A selector displays the range of revenue values, and a user can
move the slider to select the minimum and maximum revenue to display.
In the example shown below, the selector is filtering the Revenue metric
to display only those regions with Revenue between $3,343,953 and $7,983,672.
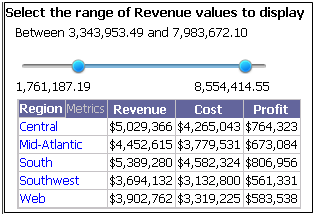
Users can also specify the beginning or end of the selected range in
the slider, by hovering the cursor over one of the endpoints of the slider
(called a thumb), clicking on the tooltip, then typing a number in the
field.
You can choose to either include or exclude the selected values from
the target. For example, in the image above, the selector includes data
for revenue values between $3,343,953 and $7,983,672, so data for regions
with revenue between $3,343,953 and $7,983,672 is displayed in the Grid/Graph.
You can choose to exclude data in the selector, to display data only for
regions with revenue that is either less than $3,343,953 or greater than
$7,983,672. If the selector
title
bar is displayed, a user can change between including or excluding
the selections.
A qualification, which the user completes to filter the metric's values. This type of metric condition selector allows a user to:
Select whether to filter on the metric values or ranking
Select the operator (equals, greater than, and so on) to use for the comparison
Type the value to filter on
For example, given
the same regional revenue Grid/Graph described above, a user could choose
to display only the revenue values greater than $5,000,000 (as shown in
the example below) or only the top-ranking 5 regions in term of revenue.
After the user completes the qualification, he clicks the check mark
to apply the qualification.
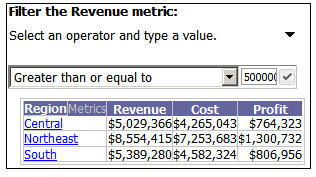
For either a slider selector or a qualification selector, the selector's title bar contains a drop-down list to select whether to filter on metric values, ranks, or percent ranks, as shown in the image below. If the title bar is hidden, the option chosen when the selector was defined is used. For instructions to display the title bar, see Adding and formatting a selector title bar.
For either a slider selector or a qualification, the metric can be displayed in a Grid/Graph or panel.
You can choose to either automatically maintain the targets of attribute and metric selectors, or manually define these targets.
If targets are automatically maintained in the layout, attribute and metric selectors automatically target all Grid/Graphs and panel stacks that are in the same panel or document section as the selector.
If targets are not automatically maintained, you must manually select the targets when you create all types of selectors.
For more information on automatic target maintenance, including instructions to enable or disable it, see Automatically maintaining targets for selectors.
You should be familiar with the various properties that define how a selector looks and what it controls, such as target and source. See Defining selectors for descriptions.
You should have added a Grid/Graph or panel stack to the document, to use as the target of the selector. For instructions, see Adding a Grid/Graph to documents or Inserting a panel stack into a document. If targets are automatically maintained, and you add a Grid/Graph or panel stack to the same document section or panel after creating the selector, the Grid/Graph or panel stack is automatically added as a target.
Open a document in Design or Editable Mode.
From the Insert menu, point to Selector, then select one of the following:
To create a slider, select Metric Slider.
To create a qualification, select Metric Qualification.
Click the section of the Layout area in which you want to place the selector. If you click and drag in the section, you can size the selector.
Right-click the new selector and select Properties and Formatting. The Properties and Formatting dialog box opens.
From the left, click Selector. The selector options are displayed.
From the Source drop-down list, select the metric to qualify on.
From the Selection Type drop-down list, select one of the following:
To use the selector to include data for selected values, select Include.
To use the selector to exclude data for selected values, select Exclude.
If the selector's title bar is not displayed, then this setting is used. If the selector's title bar is displayed, this is the default and a user can change between including or excluding the selections.
From the Qualify On drop-down list, select one of the following:
To filter on the metric's values, select Value.
To rank the metric's value, where 1 is the highest value, and then filter by rank, select Rank Highest.
To rank the metric's value, where 1 is the lowest value, and then filter by rank, select Rank Lowest.
To filter the data to display the top x% of items in the target, select Rank % Highest. For example, if the target Grid/Graph contains eight items, Rank % Highest = 25 displays the top two items.
To filter the data to display the bottom x% of items in the target, select Rank % Lowest. For example, if the target Grid/Graph contains eight items, Rank % Lowest = 25 displays the bottom two items.
If targets are not automatically maintained, you must manually specify the target of the selector, as described below:
Right-click the selector and choose Select Target. The Select Target dialog box is displayed.
Click the Grid/Graph, panel stack, or selector to use as the target. The sizing handles of the target are displayed. To select multiple targets, press CTRL and click each control to select it.
Click the Select Target icon . The controls you selected are added as targets of the selector.
Related topics