A Grid/Graph is a type of control you can add to a document. When a dataset is added to the Grid/Graph, and the document is executed, the dataset is displayed as a standard MicroStrategy report.
The background of a Grid/Graph can be:
A single color
A gradient, which is a combination of two colors
Transparent, to allow what is behind the selector to show through (default)
The background of a Grid/Graph shows only when the Grid/Graph is larger than the report data displayed inside it. The background shows when all of the following conditions are met:
The Grid/Graph is displayed as a grid report.
The Height mode and Width mode are set to Fixed, not Fit to contents. The Fixed setting allows the specified Height and Width measurements to be used. For steps, see Resizing a Grid/Graph container.
You can format the background of a Grid/Graph. For instructions, see To format the background of a Grid/Graph below.
Selectors provide documents with interactivity, allowing a user to change how he sees the data. When the user chooses an item in the selector, data related to that item is displayed in all Grid/Graphs and panel stacks targeted by the selector. You can enable attributes or metrics in a Grid/Graph to be used as a selector to target another Grid/Graph.
By default, items that are selected in a selector are highlighted with a different background color, to indicate that they are selected. You can specify the background color of selected items. This selection color is displayed in Flash Mode and Express Mode in MicroStrategy Web.
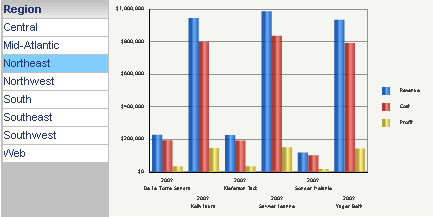
For example, you create a document with a Grid/Graph containing the Region attribute, which is used as a selector to target another Grid/Graph. The Grid/Graph's background is set to light gray, and the background for selected items is set to the default color. In Flash Mode, the selected item is automatically displayed in blue, as shown below:

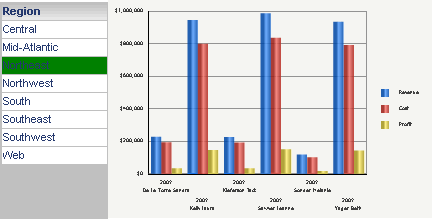
In the image below, the selection color is set to green. The selected item, Northeast, is displayed with a green background color.

The following steps format the background color of the Grid/Graph and items that are selected.
Open a document that contains the Grid/Graph in Design or Editable Mode.
Right-click the Grid/Graph container and select Properties and Formatting. The Properties and Formatting dialog box opens.
From the left, select Color and Lines.
From the Color palette, select the background color of the Grid/Graph by doing one of the following:
To apply the default background color (transparent), click No Fill.
To apply a solid background color, select the background color from the palette. You can access additional colors by clicking More Colors.
To apply a color gradient, click Gradients. The Gradients dialog box opens.
From the Color 1 palette, select the first color to use for the gradient.
From the Color 2 palette, select the second color to use for the gradient.
Select the Horizontal or Vertical option to determine the direction in which two colors are blended together, then select a shading style.
Click OK to return to the Properties and Formatting dialog box.
If the Grid/Graph is used as a selector to control other Grid/Graphs, you can specify the background color used to display selected items in the Grid/Graph. From the Selection Color palette, select the background color for items that are selected by the user by doing one of the following:
To apply the default selection color, click Automatic.
To apply a solid selection color, select the color from the palette. You can access additional colors, by clicking More Colors.
Click OK to apply changes.
Related topics