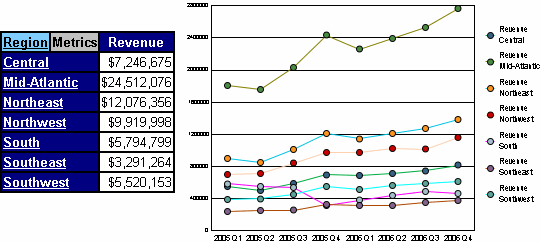
In the following image, two Grid/Graphs are shown. The grid report on the left shows revenue by region. The graph report on the right shows revenue by quarter and region. Notice that the two Grid/Graphs share a particular attribute (Region) and that Region in the grid report is underlined, indicating a link.

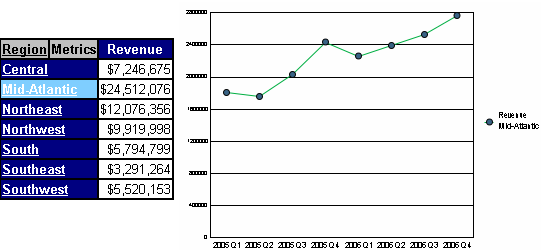
Click a specific region, such as Mid-Atlantic, in the grid report. The graph report changes to display information for that region only, as shown below:

The grid report on the left is controlling the graph report on the right. In other words, this scenario uses one Grid/Graph as a selector targeting another Grid/Graph. The first Grid/Graph does not become a selector, but performs in a manner similar to a selector. A panel stack, can also be the target of a Grid/Graph.
A Microcharts Grid/Graph often consists of several attributes in the row headers and the elements of those attributes in the rows. You can enable these attributes and elements as selectors. This allows an analyst to select an attribute or an element and view specific data related to it in other Grid/Graphs in the document.
When an analyst hovers the cursor over an attribute element that is enabled as a selector, it becomes a hand pointer to indicate that a link exists. When the link is clicked, all target Grid/Graphs on the document are updated with a set of data related to the attribute element that was clicked. For example, if you click Southeast, all data related to the Southeast region is displayed in the target Grid/Graphs on the document.
Only Grid/Graphs that are assigned as targets of the widget are updated when you choose an option from a selector.
Each attribute element on the Grid/Graph, including the attribute names in the row headers, can act as a selector. When you click an attribute name displayed in a row header, all elements of that attribute are selected. This overrides the selection of any of the individual attribute elements. The background color of the attribute in the row header is highlighted to indicate that the attribute is selected.
Attributes that are enabled as selectors in the Grid/Graph also act as selectors when displayed as rows in the widget. Clicking the name of an attribute element in the widget will update the targets of the selector.
Notes:
Metric columns cannot be used as selectors.
When two or more attributes are set as selectors, the selections occur independently of each other.
This procedure assumes that a Grid/Graph has been created to use as the selector.
A panel stack or Grid/Graph must also be created to use as the target.
The selector and target must have an attribute in common.
If targets are automatically maintained, and you add a Grid/Graph or panel stack to the same document section or panel after defining this selector, the Grid/Graph or panel stack that is added automatically becomes a target.
Open the document in Design or Editable Mode.
On a Grid/Graph, right-click the attribute to use as the selector, and choose Use as Selector or Edit Selector. The Configure Selector dialog box opens.
Select the target Grid/Graph or panel
stack in the list of available controls on the left, and click >
to add it to the list of selected targets. You can select multiple targets.
Note: If targets are automatically maintained in the layout,
you cannot select targets. All Grid/Graphs and panel stacks in the same
document section or panel as the selected Grid/Graph are automatically
chosen as targets. You can disable automatic targets by clicking the Manual
Targets button. If you do, all selectors in the layout are no longer automatically
maintained. For more information about disabling automatic target maintenance,
see
Automatically
maintaining targets for selectors.
The All option in a selector allows the user to display all the elements or metrics in the target at one time. To enable the All option, select the Show option for All check box.
Click OK to return to the document.