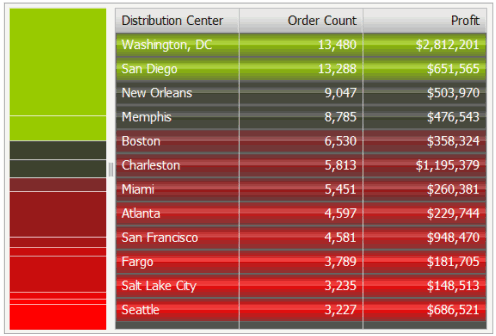
The Weighted List Viewer widget combines the data visualization techniques of thresholds and graphical weighting into a single visualization. This enables the analyst to assess the performance of a group of items.
Thresholds in the widget highlight rows based on the value of the first metric on the Grid/Graph. Specifically, rows are highlighted according to the range of values from the first metric in the Grid/Graph’s columns. The rows are also ordered automatically so that metrics that are performing well are at the top and metrics that are performing poorly are at the bottom. A stacked bar chart is included next to the grid; it indicates the relative contribution, or weight, of each row.

The Weighted List Viewer widget has the following characteristics:
A grid that provides attribute and metric values with threshold colors applied to the values from top to bottom. The color bands on the grid reflect the range of values of the first metric on the Grid/Graph.
In the example above, the top row is green and represents the maximum value of the Order Count metric. The second row is a darker shade of green and the next two rows are black, denoting neutral metric values. This light-to-dark color gradient is automatically generated by the widget. The remaining rows are red and represent the minimum range of values of the Order Count metric.
You can specify whether to divide the metric values into two or three threshold color bands. For steps, see Formatting a Weighted List Viewer widget.
A stacked contribution bar graph on the left that depicts the relative contribution or percent-to-total calculation of a metric. This bar reflects the values of the second metric on the Grid/Graph.
Specific colors are used to depict good, neutral, and poor performance:
Green indicates good performance
Black indicates neutral performance
Red indicates poor performance
You can change these color settings, as described in Formatting a Weighted List Viewer widget.
Open the document in Design or Editable mode.
From the Insert menu, point to Widgets, then Flash. Select Weighted List Viewer.
Click the location on your document, except for the Detail section, where you want to place the widget. The Grid/Graph, which appears similar to a standard grid container, is displayed. A small icon at the bottom right corner of the Grid/Graph identifies the type of widget that you have added to the document.
If desired, resize the widget by clicking and dragging its handles.
From the Dataset Objects panel on the left, select attributes and metrics, and drag them on top of the widget, as described below.
Place at least one attribute on the Grid/Graph's rows. The attribute’s elements are displayed in the grid rows of the widget. For example, if you place the Region attribute on the rows, each region is listed in the grid in the widget, with corresponding metric values on the right and a contribution chart on the left.
Place two metrics on the Grid/Graph's columns. The values of these metrics are displayed in the grid rows of the widget along with the attribute.
The first metric on the columns is the threshold metric. This metric is used to set the color of the rows displayed in the grid.
The second metric on the columns is the weighting metric that determines the percent-to-total value for each business attribute. It is used to set the relative size of each section of the contribution chart on the left side of the widget.
Additional metrics are displayed in the grid, but do not have any effect on the threshold colors or contribution chart on the left side of the widget.
View and test your results in one of two ways:
Select Flash Mode from the Home menu.
If Flash Mode is not available in the Home menu, you must make Flash Mode available in the document. For steps, see Defining which display modes are available to users.
Select Interactive Mode from the Home menu.
The widget must be enabled to be displayed in non-Flash mode to be viewable in Interactive Mode. For instructions to allow a widget to be displayed in non-Flash mode, see Determining how a widget is rendered in non-Flash modes.
Related topics