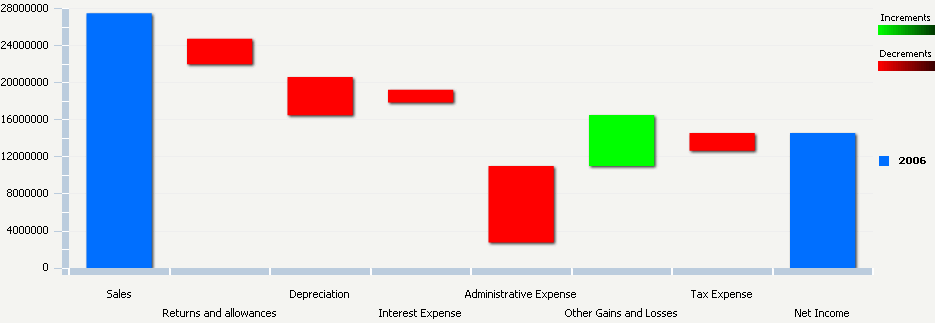
A Waterfall widget highlights the increments and decrements of the values of metrics over time. Analysts can use the widget to identify the aspects of the business that are contributing to the fluctuations in the values. The widget can also be used to perform What-if analyses.
The widget consists of a group of clustered bars displayed from left to right. The X-axis contains either attribute elements or metrics, depending on where the attributes and metrics are placed on the Grid/Graph in Design Mode or Editable Mode. The Y-axis displays a range of values based on the metrics on the Grid/Graph.

In the widget above, metrics are displayed along the X-axis. The first bar represents the amount of sales revenue generated in 2006. The remaining bars in the widget represent the remaining metrics on the X-axis, including the Depreciation and Tax Expense metrics. These bars depict the business factors that diminished revenue and one factor (the Other Gains and Losses metric) that increased revenue. As a group, these bars highlight the contributions of various aspects of the business on total revenue from sales. This final value is represented by the last bar on the right, which represents Net Income for 2006.
The increments and decrements in a Waterfall widget can be calculated and displayed in any of the following ways:
Increments and decrements are calculated and displayed in the widget according to the metrics that are included on the Grid/Graph that contains the widget and the order of those metrics.
It is recommended that you use this method when the metrics are on the rows of the Grid/Graph and the attributes are on the columns of the Grid/Graph. This allows you to place the metrics along the X-axis in a specific order and view the increment and decrement bars in that order.
To ensure that the metrics determine how increments and decrements are calculated and displayed, select the Increments/Decrements Provided check box. See the steps below for instructions on accessing this check box.
Increments and decrements are automatically determined by the widget when it is displayed in MicroStrategy Web. They are calculated according to the metrics included on the Grid/Graph.
It is recommended that you use this method when the metrics are placed on the columns of the Grid/Graph and the attributes are placed on the rows of the Grid/Graph. Using this method requires that you have placed metrics on the columns that depict the total value for each unit of time.
To ensure that the widget automatically determines the increments and decrements, clear the Increments/Decrements Provided check box. See the steps below for instructions on accessing this check box.
To create and add a Waterfall widget to a document
Open the document in Design or Editable mode.
From the Insert menu, point to Widgets, then Flash. Select Waterfall.
Click the location on the document, other than in the Detail section, to place the widget. The Grid/Graph that contains the widget, which is similar to a standard grid container, is displayed. A small icon is displayed at the bottom right of the Grid/Graph, identifying the type of widget that you added to the document.
If required, resize the widget by clicking and dragging its handles.
To add objects to the Grid/Graph
From the Dataset Objects panel on the left, select attributes and metrics, and drag them on top of the widget, as described below.
Place at least one metric on the rows or columns. Any number of metrics and attributes can be placed on the rows and columns.
Attributes
or metrics that are placed on the rows are displayed on the X-axis of
the widget. If the rows contain both attributes and metrics, a combination
of those objects is displayed.
Note: If you want the metrics on the Grid/Graph
to generate the increment and decrement bars in the widget, place the
metrics on the rows.
Attributes and/or metrics that are placed on the columns are displayed in the legend. If the columns contain both attributes and metrics, a combination of those objects is displayed.
To enable the widget to be displayed
View and test your results in one of two ways:
Select Flash Mode from the Home menu.
If Flash Mode is not available in the Home menu, you must make Flash Mode available in the document. For steps, see Defining which display modes are available to users.
Select Interactive Mode from the Home menu.
The widget must be enabled to be displayed in non-Flash mode to be viewable in Interactive Mode. For instructions to allow a widget to be displayed in non-Flash mode, see Determining how a widget is rendered in non-Flash modes.
To specify if the metrics in the widget should be used to generate the increment and decrement bars
Right-click the widget and select Properties. The Properties dialog box opens.
Click the Data tab, then do one of the following:
To
ensure that Increments and Decrements bars are displayed in the
widget in the same order of the metrics on the Grid/Graph, select the
Increments/Decrements Provided
check box.
It is recommended that you use this method when the metrics are
placed on the rows of the Grid/Graph and the attributes are placed on
the columns of the Grid/Graph. This allows you to place the metrics along
the X-axis in a specific order and display the Increment
and Decrement bars in that same
order.
To
ensure that the increments and decrements bars in the widget are generated
automatically, clear the Increments/Decrements
Provided check box.
It is recommended that you use this method when the metrics are
placed on the columns of the Grid/Graph and the attributes are placed
on the rows of the Grid/Graph.
On the Data tab, use the Text For Last Entry field to specify a name or label for the bar on the far right of the widget. For example, you can create a label for the bar called Final Value or End of 2008.
Click OK.
Related topics
Inserting a widget into a document