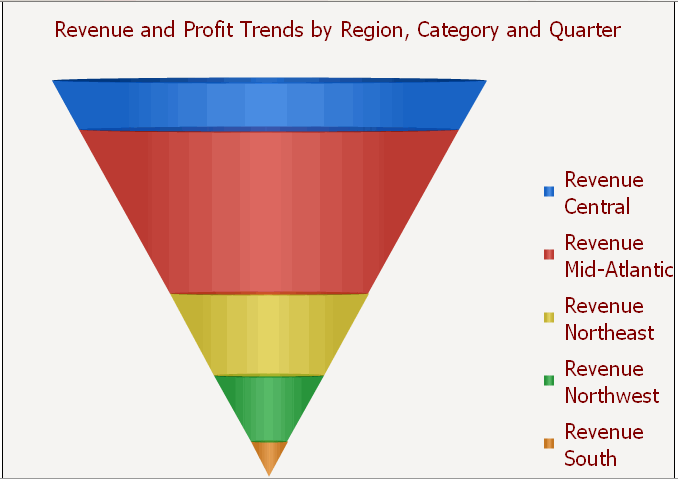
The Funnel widget can be used for a wide variety of business purposes, including application management, click management, pipeline analyses for sales forecasts, and sales process analysis. The widget is a variation of a stacked percent bar chart that displays data that adds up to 100%.

Therefore, it can allow analysts to visualize the percent contribution of sales data or the stages in a sales process and reveal the amount of potential revenue for each stage. When the widget is used to analyze a sales process, analysts can use the widget to drill down to key metrics such as deal size, profit potential, and probability of closing. The widget can also be used to identify potential problem areas in an organization’s sales processes.
Open the document in Design or Editable mode.
From the Insert menu, point to Widgets, then Flash. Select Funnel.
Click the location on your document, except for the Detail section, where you want to place the widget. The Grid/Graph, which appears similar to a standard grid container, is displayed. A small icon at the bottom right corner of the Grid/Graph identifies the type of widget that you have added to the document.
If desired, resize the widget by clicking and dragging its handles.
From the Dataset Objects panel on the left, select attributes and metrics, and drag them on top of the widget, as described below:
Place at least one attribute on the Grid/Graph's rows. The attributes are displayed as separate sections in the widget.
Place at least one metric on the Grid/Graph’s columns. The size of each section of the widget is determined by the values of the metric.
View and test your results in one of two ways:
Select Flash Mode from the Home menu.
If Flash Mode is not available, you must make Flash Mode available in the document. For steps, see Defining which display modes are available to users.
Select Interactive Mode from the Home menu.
The widget must be enabled to be displayed in non-Flash mode to be viewable in Interactive Mode. For instructions to allow a widget to be displayed in non-Flash mode, see Determining how a widget is rendered in non-Flash modes.
Related topics
Inserting a widget into a document