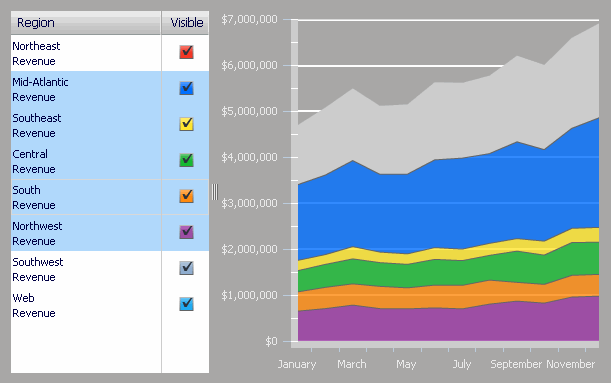
An Interactive Stacked Graph widget presents a combination of a check box list and an area graph. The graph allows a user to see the contribution of various metric series to the change in value of a larger set of data. By selecting individual attribute elements (for example, a list of years) using the check boxes, analysts determine what data is displayed on the area graph on the right. This widget allows you to visualize total metric values as one large stacked area, and the individual pieces of that total as smaller stacked areas within the large stacked area. You can quickly analyze how the individual parts make up the whole, which is useful when making percent-to-total comparisons.
The data requirements for this type of widget are as follows:
One attribute on the Grid/Graph's rows, which is displayed on the graph's X-axis. In the image below, this is the Month of Year attribute.
One attribute on the Grid/Graph's columns, which is represented by the check box list on the left. In the image below, this is the Region attribute.
One metric on the Grid/Graph's columns, which is displayed on the graph's Y-axis. In the image below, this is the Revenue metric.

Open the document in Design or Editable mode.
From the Insert menu, point to Widgets, then Flash. Select Interactive Stacked Graph.
Click the location on your document, except for the Detail section, where you want to place the widget. The Grid/Graph, which appears similar to a standard grid container, is displayed. A small icon at the bottom right corner of the Grid/Graph identifies the type of widget that you have added to the document.
If desired, resize the widget by clicking and dragging its handles.
Add objects to the Grid/Graph that contains the widget. To do this, from the Dataset Objects panel on the left, select attributes and metrics and drag them on top of the widget, using the following requirements:
Place at least two attributes, one on the rows and one on the columns.
The attribute placed on the Grid/Graph's rows is displayed on the graph's X-axis.
The attribute placed on the Grid/Graph's columns appears in the list of check boxes on the left side of the widget. For example, if you place a Category attribute in the columns and then switch to Flash Mode, the list of categories is displayed on the left as check boxes. You can select each check box to show or hide that specific data on the area graph. Attributes placed on the columns must appear above (or to the left of) any metrics on the columns.
Place only one metric on the columns. The metric values are displayed on the Y-axis of the graph. The metric must appear below (or to the right of) any attributes on the columns. You can place any number of attributes on the Grid/Graph that contains the widget, but it can have only one metric.
View and test your results by selecting Flash Mode from the Tools menu.
If Flash Mode is not available, you must make Flash Mode available in the document. For steps, see Defining which display modes are available to users.
Click OK to apply the changes and return to the document.
Related topics