If a report is displayed as a graph, you can drill to different levels of data by clicking directly on the components of the graph, if the report's designer has enabled any drill paths for that report. You can also right-click graph components to access additional drill paths. When you drill, a new graph is displayed.
Each graph component you can drill on is explained in the table below.
The following applies to drilling on a graph report:
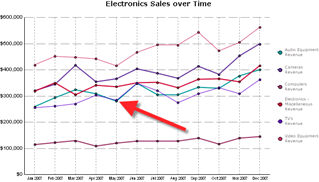
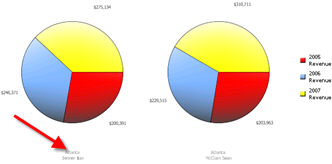
Clicking a graph component (such as a bar in a bar graph) is similar to drilling on a row and column in a grid report.
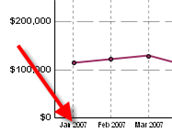
Clicking an X-axis label is the same as drilling on a row in a grid report.
Clicking a legend label is the same as drilling on a column in a grid report. The original graph reappears if there is no valid drill path available.
To return
to the original report results, click Back
above the report.
Note: Clicking the Back
button on your browser does not return you to the original report results.
The following table lists areas on a graph report on which you can drill. You can drill on different areas depending on the type of graph with which you are working.
Component Of Graph You Can Drill On
|
Description Of Graph Component And Drilling Behavior |
Graph Types You Can Drill On When They Have This Component
|
Data markers |
Values represented in the graph series. Data markers appear in different ways, depending on the graph type. For example, in a Line graph, the data markers are the dots along the line. In a Bar graph, the data markers are the bars. |
All graph types
|
Legend Text |
The text next to the legend marker. Each legend text corresponds to a series marker. |
All graph types where the legend is visible |
Legend Series Marker |
The item that identifies each series on the graph. Each marker corresponds to one row or column in the report. For multi-value charts (Bubble, Scatter, and so on) it corresponds to a set of columns or rows. |
All graph types where the legend is visible |
Category/Group Labels |
Labels on the X-axis. |
Area, Bar, Column, Line, 3D Surface |
Pie Group Labels |
Labels below each one of the pies in any of the pie charts (including Rings). Each label corresponds to one row or column in the report. |
Pie
|
Series Labels |
Labels along the series axis. Each label corresponds to one row or column in the report. |
3D Surface |
Related topics