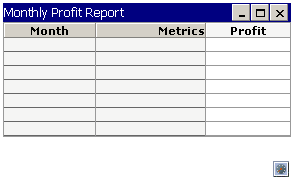
A title bar above the grid report or graph report on a Grid/Graph control allows users to minimize and maximize the Grid/Graph, and it identifies the dataset report displayed in the Grid/Graph control. You can format the title bar independently of the Grid/Graph container.
The title bar looks like the following. It is the bar at the very top of the Grid/Graph.

If you include several Grid/Graphs with title bars in a document, you can create the feel of a portal-style dashboard in your documents. The Grid/Graphs can all be displayed, or a user can minimize the ones that are not relevant at the moment to focus on a particular Grid/Graph.
A title bar:
Displays the title of the report by default, although you can replace it with your own text.
Is displayed in all views for Web.
Allows Web users to minimize and maximize the Grid/Graph. This interactivity is available in Editable Mode and Interactive Mode.
Allows Web users to quickly open and examine the dataset report displayed in the Grid/Graph directly from a document.
Lets the document designer determine the initial state of the window: normal, minimized, or maximized. The initial state, which is controlled by the Display state property, is used in all modes in Web.
Open the document in Design or Editable Mode.
Right-click the Grid/Graph and select Properties and Formatting. The Properties and Formatting dialog box opens.
From the left, select General.
Select the Show Title Bar check box.
By default, the name of the dataset report is displayed in the title bar. To display a different title, type the new text in the Title field.
To change the initial display height and width of the Grid/Graph, select one of the following from the Display State drop-down list:
Minimized: Only the title bar is initially displayed. A user can move the grid report or graph report but cannot resize it.
Maximized: The size of the grid report or graph report is initially displayed at the size of the document section in which it is located.
To specify the height of the title bar itself, from the left select Layout. Then type the height in the Title Height field.
To format the background fill of the title bar:
Select Colors and Lines from the left. The Colors and Lines options are displayed.
Select Grid Container in the drop-down list on the left.
Select Title in the drop-down list on the right.
From the Color drop-down list, do one of the following:
To shade the title bar with a solid fill color, select the desired color.
To shade the title bar with a color gradient, select Gradient. For detailed steps to add gradient colors, see Applying gradient colors.
To allow what is behind the title bar to show through, select No Color.
Click OK to apply the changes and close the dialog box.